Debugging Techniques in jQuery
Debugging is a critical skill for any developer, especially when working with JavaScript and jQuery. In this chapter, we will explore various techniques for debugging jQuery code, covering everything from basic methods to advanced strategies.
Introduction to Debugging in jQuery
What is Debugging?
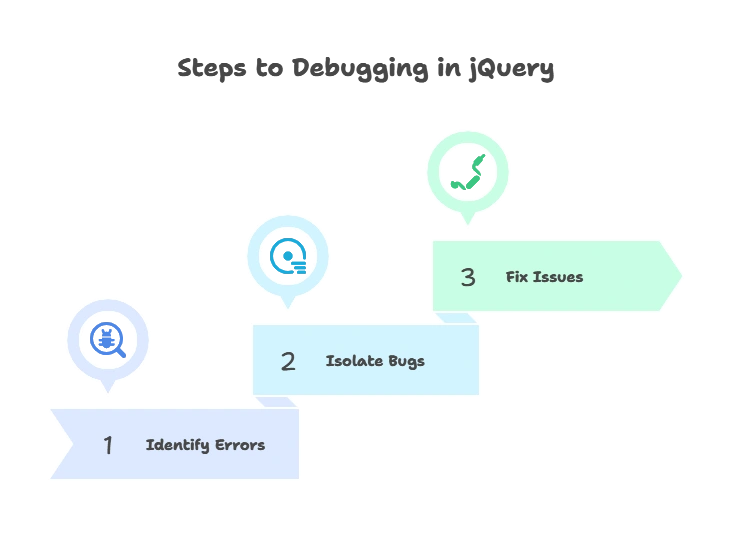
Debugging is the process of identifying, isolating, and fixing errors or bugs in your code. With jQuery, debugging can involve issues related to DOM manipulation, event handling, AJAX calls, and more.
Why is Debugging Important?
- Helps identify syntax errors, logic errors, and runtime errors.
- Ensures smooth application functionality.
- Saves development time by allowing you to quickly resolve issues.
- Improves code quality and user experience.

Basic Debugging Techniques in jQuery
1. Using console.log() for Debugging
The most common and simplest debugging technique is to use console.log() to output variables, function results, and messages to the browser’s console.
Example:
<button id="myButton">Click Me</button> <script type="litespeed/javascript">$(document).ready(function(){$("#myButton").click(function(){let text=$("#myButton").text();console.log("Button Text: "+text)})})</script>
Explanation:
- When the button is clicked, the
console.log()function prints the button’s text to the browser console, allowing you to inspect the value.
Output: The console will display:
Button Text: Click Me
2. Debugging with console.error()
If you want to log an error message, you can use console.error(). This makes the error stand out in the console with a red warning symbol.
Example:
					$(document).ready(function() {
    try {
        let value = $("#nonExistentElement").text();
        if (!value) {
            throw new Error("Element not found!");
        }
    } catch (error) {
        console.error("An error occurred: " + error.message);
    }
});
Explanation:
- This code attempts to access a non-existent element, throws an error if it’s not found, and logs the error message using
console.error().
Output: In the browser console, you will see:
An error occurred: Element not found!
3. Using console.table() for Arrays and Objects
If you need to debug arrays or objects, console.table() provides a visual way to display data in a tabular format.
Example:
					let fruits = ["Apple", "Banana", "Cherry"];
console.table(fruits);
Explanation:
- This method displays the array items in a table format in the console, making it easier to inspect complex data structures.
Output: The console will show a neatly formatted table with the values of the array:
					(0) "Apple"
(1) "Banana"
(2) "Cherry"
Advanced Debugging Techniques
1. Setting Breakpoints in the Browser Developer Tools
One of the most powerful debugging tools available in modern browsers is the ability to set breakpoints in JavaScript and jQuery code. This allows you to pause execution at a specific line and inspect the state of the application.
How to Set a Breakpoint:
- Open the browser’s Developer Tools (usually
F12orCtrl+Shift+I). - Go to the “Sources” tab.
- Find your jQuery file and click on a line number to set a breakpoint.
Once the execution is paused, you can:
- Inspect variable values.
- Step through the code line-by-line.
- Resume or halt the code execution.
Example:
<button id="breakpointBtn">Click to Break</button> <script type="litespeed/javascript">$(document).ready(function(){$("#breakpointBtn").click(function(){let message="Button clicked!";console.log(message)})})</script>
Explanation:
- You can set a breakpoint on the
console.log(message)line, which will pause execution when the button is clicked, allowing you to inspect themessagevariable.
2. Using debugger Statement in Code
The debugger statement allows you to programmatically pause the execution of your code, similar to setting a manual breakpoint.
Example:
					$(document).ready(function() {
    let num = 5;
    debugger; // Execution will pause here
    num *= 2;
    console.log(num);
});
Explanation:
- When the code reaches the
debuggerstatement, it pauses, allowing you to inspect variables and the state of the program.
3. Handling AJAX Request Errors
jQuery’s AJAX methods come with built-in error handling mechanisms. You can debug AJAX requests by using the error callback function or by checking the response object.
Example:
					$.ajax({
    url: "nonexistent-file.html",
    success: function(data) {
        console.log("Request succeeded.");
    },
    error: function(xhr, status, error) {
        console.log("AJAX error: " + status + " - " + error);
        console.log(xhr.responseText); // Logs the full response text
    }
});
Explanation:
- If the AJAX request fails, the error callback logs the status and error message to the console, helping you debug the issue.
Output:
AJAX error: 404 - Not Found
Using jQuery .error() Method
The .error() method in jQuery is used to capture errors that occur when loading elements, such as images or scripts.
Example:
<img data-lazyloaded="1" src="data:image/gif;base64,R0lGODdhAQABAPAAAMPDwwAAACwAAAAAAQABAAACAkQBADs=" decoding="async" data-src="nonexistent-image.jpg" id="myImage" alt="Debugging Techniques in jQuery" title="Debugging Techniques in jQuery 2"> <script type="litespeed/javascript">$("#myImage").error(function(){console.log("Image failed to load.")})</script>
Explanation:
- When the image fails to load, the
.error()method logs a message to the console, notifying you that the image wasn’t found.
Output:
Image failed to load.
Real-Time Debugging with LiveReload or BrowserSync
To speed up the development and debugging process, you can use tools like LiveReload or BrowserSync. These tools automatically refresh the browser whenever you make changes to your code, allowing you to see the results instantly.
How to Set Up LiveReload:
- Install the LiveReload browser extension.
- Install the LiveReload plugin or set up a task runner like Gulp or Grunt to enable real-time reloading.
This ensures that you can see your changes and debug the application in real-time without manually refreshing the browser.
jQuery .when() and .fail() for Promise Debugging
jQuery’s $.when() method allows you to handle multiple asynchronous operations, such as AJAX requests. You can combine this with .fail() for error handling.
Example:
					$.when(
    $.get("page1.html"),
    $.get("page2.html")
).done(function(data1, data2) {
    console.log("Both requests succeeded.");
}).fail(function(jqXHR, textStatus, errorThrown) {
    console.log("An error occurred: " + textStatus);
});
Explanation:
- This example performs two AJAX requests in parallel. If either fails, the
.fail()method logs the error message.
Debugging is an essential skill for any jQuery developer, and with the tools and techniques discussed in this chapter, you can effectively troubleshoot and resolve issues in your code. Whether using basic techniques like console.log() or advanced methods like setting breakpoints, understanding how to debug ensures smoother development and better-quality applications. Happy Coding!❤️
