Debugging is an essential skill for any C++ programmer. It's the process of identifying and resolving errors (bugs) in your code that prevent it from functioning as intended. This chapter equips you with a comprehensive toolbox of debugging techniques, ranging from basic principles to advanced tools.
Understanding Errors and Debugging
Types of Errors
- Syntax Errors: Violations of C++ grammar rules, typically detected during compilation. Examples include missing semicolons, mismatched parentheses, or undeclared variables.
- Runtime Errors: Errors that occur during program execution. These can be crashes, unexpected behavior, or infinite loops. Examples include accessing memory outside array bounds, division by zero, or null pointer dereference.
- Logic Errors: Mistakes in the program’s logic that cause incorrect results even if the code runs without errors. These can be more challenging to identify as the program might execute seemingly fine but produce wrong outputs.
The Debugging Process
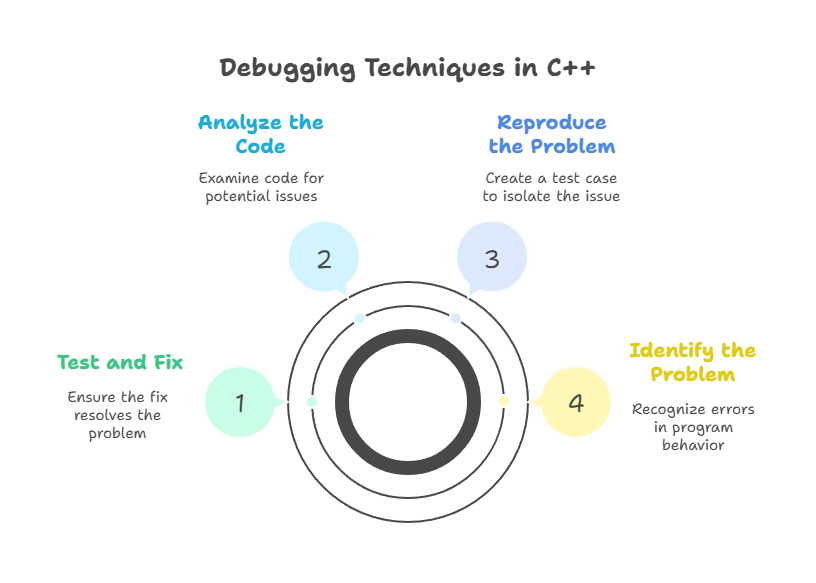
- Identify the Problem: Recognize that something is wrong based on incorrect output, crashes, or unexpected behavior.
- Reproduce the Problem: Create a minimal test case that consistently reproduces the issue. This isolates the problematic section of code.
- Analyze the Code: Examine the code around the error location, considering logic flow, variable values, and potential issues.
- Test and Fix: Modify the code to address the identified issue and thoroughly test to ensure the fix resolves the problem without introducing new ones.

Basic Debugging Techniques
Print Statements
Insert std::cout statements strategically to print variable values at different points in your code. This helps you track the flow of execution and identify unexpected changes in variables.
					int main() {
  int x = 5;
  std::cout << "x before modification: " << x << std::endl;
  // Code that might modify x
  std::cout << "x after modification: " << x << std::endl;
  return 0;
}
					// output //
x before modification: 5
x after modification: (value after modification)
The Debugger
Most development environments come with a debugger, a powerful tool for stepping through your code line by line. You can:
- Set breakpoints to pause execution at specific lines.
- Inspect variable values at each breakpoint.
- Step through the code line by line to observe how values change.
Note – Using a debugger is highly recommended for complex logic errors and runtime issues.
Advanced Debugging Techniques
Assertions
Assertions are statements that you expect to be true during code execution. You can use the assert macro from <cassert> to verify assumptions and catch potential errors early. If an assertion fails, the program typically terminates with an error message indicating the location of the failed assertion.
					void divide(int dividend, int divisor) {
  assert(divisor != 0); // Assertion to prevent division by zero
  int result = dividend / divisor;
  // ...
}
Logging
Logging statements write messages to a file or console during program execution. This can be helpful for tracking program flow, identifying errors, and debugging complex issues. Popular logging libraries like spdlog or Google’s logging framework can be used for structured and detailed logging.
Debugging Memory Issues
- Memory Leaks: When you allocate memory dynamically using
newbut forget to deallocate it withdelete, it becomes a leak, wasting memory and potentially impacting performance. Tools like memory profilers can help identify memory leaks in your program. - Dangling Pointers: If a pointer points to memory that has already been deallocated, it’s a dangling pointer and using it can lead to crashes or unexpected behavior. Be cautious when passing pointers around and ensure proper memory management.
Debugging Tools
- Valgrind: A powerful memory debugging and profiling tool that can detect memory leaks, invalid memory access, and other issues.
- GDB (GNU Debugger): A command-line debugger offering advanced features for low-level debugging.
These tools require more advanced understanding but can be invaluable for complex debugging tasks.
Debugging Tips and Best Practices
- Write clean and well-commented code: This improves readability and maintainability, making debugging easier.
- Use meaningful variable names: Descriptive names make it easier to understand the purpose of variables during debugging.
- Test your code incrementally: As you write code, write unit tests to verify the functionality of individual parts. This helps catch errors early on.
- Don’t be afraid to experiment: Try different approaches to isolate the issue. Sometimes, a temporary modification can reveal the root cause of the problem.
- Seek help: If you’re stuck, don’t hesitate to ask for help from online forums, communities, or experienced programmers. A fresh perspective can often lead to new insights.
- Learn from your mistakes: Analyze the bugs you encounter and use that knowledge to improve your coding skills and prevent similar issues in the future.
Remember
- Combine different debugging techniques: There’s no single best approach. Use a combination of print statements, debuggers, assertions, and logging to tackle different types of errors.
- Practice makes perfect: The more you debug, the better you’ll become at identifying and resolving issues.
- Debugging is an iterative process: Be patient, methodical, and don’t give up until you find the root cause of the problem.
Effective debugging is a crucial skill for any C++ programmer. By mastering the techniques covered in this chapter, you'll be well-equipped to identify and resolve errors efficiently. Happy coding !❤️
