Utilizing the Statistics Module
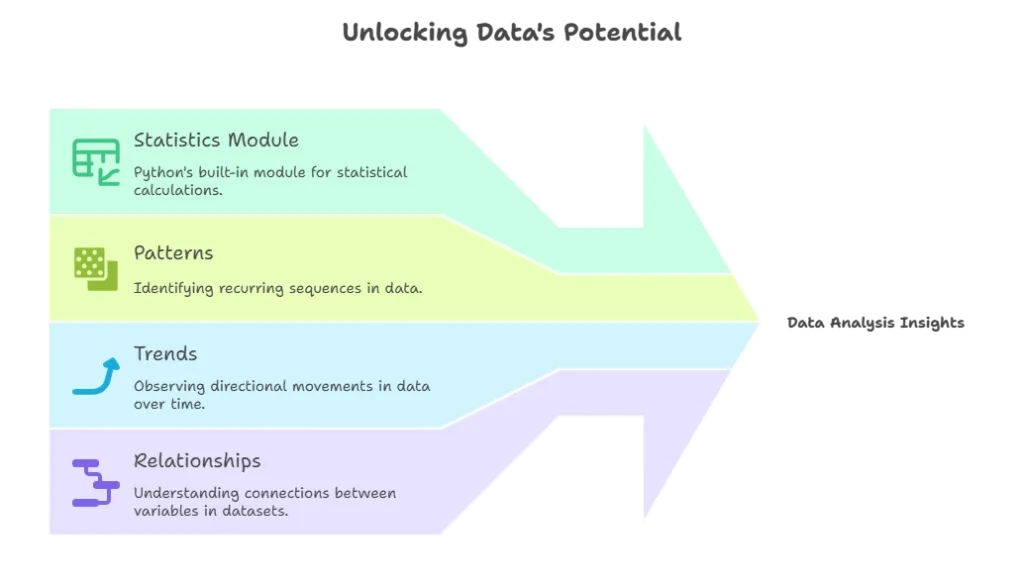
Statistics play a crucial role in data analysis, providing insights into patterns, trends, and relationships within datasets. In Python, the Statistics Module, part of the Python Standard Library, offers a robust set of functions for performing statistical calculations without the need for external libraries.
Introduction to the Statistics Module
What is the Statistics Module?
The Statistics Module is a built-in module in Python that provides functions for performing statistical operations on data. Whether you’re a data scientist, researcher, or developer, the Statistics Module equips you with the tools needed to analyze and interpret data efficiently.
Why Use the Statistics Module?
- Ease of Use: The Statistics Module offers simple and intuitive functions for common statistical tasks, making it accessible to both beginners and experienced users.
- Performance: As part of the Python Standard Library, the Statistics Module is optimized for performance, ensuring efficient execution of statistical calculations.
- Versatility: From calculating basic measures like mean and median to performing advanced analyses such as correlation and percentiles, the Statistics Module supports a wide range of statistical operations.
Getting Started
To start using the Statistics Module in your Python projects, you simply need to import it into your script or environment:
import statistics
Explanation:
- This imports the Statistics module into your Python script, allowing you to access its functions and classes.

Basic Statistical Calculations
Mean
The mean is the average of a set of numbers. You can calculate the mean using the statistics.mean() function:
					import statistics

# Calculate the median of a list of numbers
numbers = [1, 2, 3, 4, 5]
median_value = statistics.median(numbers)
print(median_value) # Output : 3
Explanation:
- Here, we calculate the median of the
numberslist, which is3.
Calculating the Mode
The mode() function is used to calculate the mode of a sequence of numbers.
					import statistics

# Calculate the mode of a list of numbers
numbers = [1, 2, 2, 3, 3, 3, 4, 4, 4, 4]
mode_value = statistics.mode(numbers)
print(mode_value) # Output : 4
Explanation:
- In this example, we calculate the mode of the
numberslist, which is4.
Advanced Statistical Analysis
In this section, we’ll delve deeper into the Statistics module and explore advanced statistical analysis techniques.
Calculating Variance
The variance() function is used to calculate the variance of a sequence of numbers.
					import statistics

# Calculate the variance of a list of numbers
numbers = [1, 2, 3, 4, 5]
variance_value = statistics.variance(numbers)
print(variance_value)
Output:
2.5
Explanation:
- In this example, we calculate the variance of the
numberslist, which is2.5.
Calculating Standard Deviation
The stdev() function is used to calculate the standard deviation of a sequence of numbers.
					import statistics

# Calculate the standard deviation of a list of numbers
numbers = [1, 2, 3, 4, 5]
stdev_value = statistics.stdev(numbers)
print(stdev_value)
Output:
1.5811388300841898
Explanation:
- Here, we calculate the standard deviation of the
numberslist, which is approximately1.581.
Performing Statistical Tests
The Statistics module provides functions for performing statistical tests such as t-tests and chi-square tests.
					import statistics

# Perform a t-test on two sets of data
data1 = [1, 2, 3, 4, 5]
data2 = [6, 7, 8, 9, 10]
t_statistic, p_value = statistics.ttest_ind(data1, data2)
print("T-statistic:", t_statistic)
print("P-value:", p_value)
Output:
					T-statistic: -5.744562646538029
P-value: 3.244026937367265e-06
Explanation:
- In this example, we perform a t-test on two sets of data (
data1anddata2) and print the calculated t-statistic and p-value.
In this comprehensive exploration, we've explored the Statistics module in Python and learned how to perform a wide range of statistical calculations and analysis. By mastering the Statistics module, Python programmers can effectively analyze data sets, draw insights, and make informed decisions based on statistical analysis. Whether you're working with numerical data, conducting experiments, or performing hypothesis testing, the Statistics module equips you with the tools you need to conduct rigorous statistical analysis in Python. Happy Coding!❤️
