Logging and Monitoring in Node.js Applications
Effective logging and monitoring are essential for building robust, maintainable, and scalable Node.js applications. Proper logging provides insights into how your application is running, helps track bugs, and provides a historical record of events. Monitoring, on the other hand, allows you to track application performance, resource usage, and errors in real-time.
Introduction to Logging and Monitoring
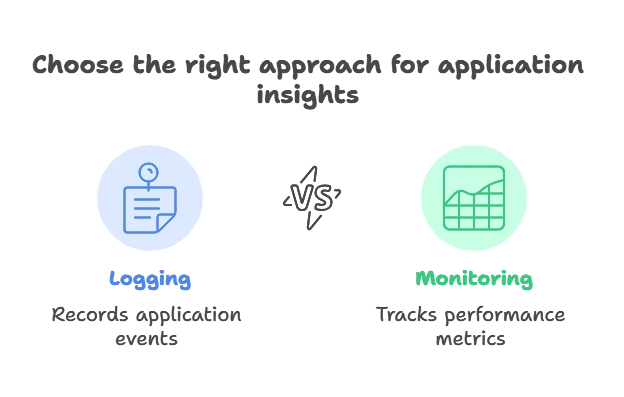
Logging and monitoring are the primary ways to gain insights into your application’s runtime behavior. While logging focuses on recording application events (like errors or user actions), monitoring focuses on tracking application performance metrics and health. Together, they play a crucial role in ensuring application reliability and stability.

Why Logging is Important
Logging provides visibility into what’s happening within your application. Here are the primary reasons to use logging:
- Error Tracking: Logs help trace issues when errors occur.
- Debugging: Debug information is helpful for troubleshooting issues during development and in production.
- Security: Logs provide an audit trail of actions, which is essential for security auditing.
- Analytics: Logs can be used to analyze user behavior and app usage.
Basics of Logging in Node.js
Node.js offers basic logging with console.log(), but logging libraries provide more control and features, such as logging levels and formatters.
Using console.log()
					console.log("This is a log message");
console.error("This is an error message");
While console.log is helpful for simple debugging, it lacks features like log levels, structured formatting, and timestamping.
Introducing winston for Logging
winston is a popular logging library in Node.js, providing flexible and feature-rich logging capabilities.
1. Install winston:
npm install winston
2. Setup Basic Winston Logger:
					// logger.js
const winston = require('winston');

const logger = winston.createLogger({
  level: 'info',
  format: winston.format.json(),
  transports: [
    new winston.transports.Console(),
    new winston.transports.File({ filename: 'app.log' })
  ],
});

module.exports = logger;
3. Using the Logger:
					// app.js
const logger = require('./logger');

logger.info("Application started successfully");
logger.error("An error occurred");
Explanation:
- The
loggerobject defines two log levels:infoanderror. - Logs are saved both to the console and a file (
app.log).
Output:
- Logs appear on the console and are saved in
app.login JSON format.
Advanced Logging Techniques
Log Levels
Log levels determine the severity of logs and control what is displayed based on the environment.
					const logger = winston.createLogger({
  levels: winston.config.npm.levels,
  level: process.env.NODE_ENV === 'production' ? 'error' : 'debug',
});
Log Rotation
Log rotation prevents log files from growing indefinitely. Using winston-daily-rotate-file:
npm install winston-daily-rotate-file
					const DailyRotateFile = require('winston-daily-rotate-file');

const logger = winston.createLogger({
  transports: [
    new DailyRotateFile({
      filename: 'application-%DATE%.log',
      datePattern: 'YYYY-MM-DD',
      maxFiles: '14d'
    })
  ]
});
Monitoring in Node.js
Monitoring tracks performance metrics like CPU usage, memory, and request latency. Monitoring helps detect and address performance bottlenecks and track application health.
Key Metrics to Monitor
- CPU and Memory Usage: Determines if the application is using resources efficiently.
- Response Time: Measures the time taken to respond to requests.
- Error Rate: Tracks the frequency of errors in your application.
- Throughput: Measures requests per second.
- Uptime: Monitors the availability of your application.
Implementing Application Monitoring
Using Node.js Built-in process Module
The process module in Node.js allows monitoring CPU and memory usage:
					setInterval(() => {
  const memoryUsage = process.memoryUsage();
  console.log(`Memory Usage: ${memoryUsage.rss / 1024 / 1024} MB`);
}, 10000);
Using express-status-monitor with Express.js
For Express.js applications, express-status-monitor provides a simple way to view server metrics.
1. Install:
npm install express-status-monitor
2. Set Up in Express:
					const express = require('express');
const statusMonitor = require('express-status-monitor');

const app = express();
app.use(statusMonitor());

app.get('/', (req, res) => res.send('Hello World'));
app.listen(3000, () => console.log('Server is running on port 3000'));
3. Access Metrics Dashboard:
- Start your application and navigate to
/status.
Tools for Logging and Monitoring in Node.js
1. Winston: A versatile logging library.
2. Morgan: Middleware for HTTP request logging.
3. Prometheus and Grafana: For detailed monitoring and visualization.
4. Elastic Stack (ELK): Elasticsearch, Logstash, and Kibana for centralized log management.
5. DataDog: Comprehensive logging and monitoring for distributed applications.
Setting Up a Centralized ELK Stack for Logs
- Logstash gathers logs from multiple sources.
- Elasticsearch stores and indexes log data.
- Kibana visualizes and queries logs.
Example Setup:
- Connect
winstonto Logstash using thewinston-logstashtransport.
					const winston = require('winston');
require('winston-logstash');

const logger = winston.createLogger({
  transports: [
    new winston.transports.Logstash({ port: 5000, node_name: 'node_app', host: 'logstash_host' })
  ]
});
Best Practices for Logging and Monitoring
- Use Different Log Levels: Set
debugduring development anderrororwarnin production. - Avoid Logging Sensitive Information: Keep passwords, tokens, and personal data out of logs.
- Use Structured Logs: JSON is widely compatible and enables structured logging.
- Monitor Essential Metrics Only: Avoid overhead by focusing on key metrics.
- Implement Alerts: Use tools like Prometheus and Grafana to set up alerts for metrics like high memory usage.
- Centralize Logs: A centralized log management solution simplifies monitoring and debugging.
Logging and monitoring are integral to maintaining the health, performance, and reliability of your Node.js applications. While basic console logging is helpful in development, production environments require more advanced tools like winston and monitoring solutions like Prometheus and Grafana. With proper logging, you can trace errors, debug efficiently, and gain insights into application usage. Monitoring provides the ability to view application health and respond to performance issues in real-time, which helps maintain a high-quality user experience. Together, logging and monitoring enable effective maintenance, scalability, and troubleshooting of Node.js applications. Happy Coding!❤️
