Profiling Memory Usage in Go
Memory profiling is a crucial aspect of software development, especially when working with memory-intensive applications. In Go, memory profiling helps developers identify memory leaks, inefficient memory usage, and optimize their programs for better performance. This chapter will delve into the fundamentals of memory profiling in Go, covering basic concepts, tools, techniques, and advanced strategies to effectively manage memory usage in your Go programs.
Understanding Memory Management in Go
Basics of Memory Management
In Go, memory management is handled by the runtime, which includes features like automatic memory allocation and garbage collection. Understanding how memory is managed in Go is essential for effective memory profiling.
Memory Allocation
Go uses a managed heap for memory allocation, where objects are allocated using the new keyword or by declaring variables. We’ll explore how memory allocation works in Go and its implications for memory profiling.
					func main() {
    var x int             // Variable declaration
    y := new(int)         // Using `new` keyword for allocation
    fmt.Println(x, *y)
}
var x intdeclares a variablexof typeint.y := new(int)allocates memory for an integer using thenewkeyword.fmt.Println(x, *y)prints the values ofxand the integer pointed to byy.
Introduction to Memory Profiling Tools
pprof Tool
Go provides the pprof package for profiling various aspects of Go programs, including memory usage. We’ll explore how to use the pprof tool for memory profiling.
Heap Profiling
Heap profiling with pprof allows us to analyze memory allocations and identify memory-intensive parts of our code. We’ll delve into heap profiling and interpreting its results.
					import (
    "os"
    "runtime/pprof"
)

func main() {
    f, _ := os.Create("profile")
    pprof.WriteHeapProfile(f)
    defer f.Close()
}
This code snippet profiles heap allocations and writes the result to a file named “profile”.
Analyzing Memory Profiles
Visualizing Memory Profiles
Visualizing memory profiles helps in understanding memory usage patterns and identifying areas for optimization. We’ll explore tools and techniques for visualizing memory profiles generated by pprof.
Interpreting Memory Profile Data
Interpreting memory profile data involves analyzing memory allocations, heap objects, and memory growth over time. We’ll discuss how to interpret memory profile data effectively.
					import (
    "log"
    "net/http"
    _ "net/http/pprof"
)

func main() {
    go func() {
        log.Println(http.ListenAndServe("localhost:6060", nil))
    }()
}
- This code snippet sets up a web server for profiling data visualization at
localhost:6060/debug/pprof.
Advanced Memory Profiling Techniques
Custom Memory Profiling
Custom memory profiling involves instrumenting code to track specific memory usage patterns or objects. We’ll explore techniques for custom memory profiling in Go.
Memory Optimization Strategies
Optimizing memory usage requires understanding data structures, allocation patterns, and reducing unnecessary allocations. We’ll discuss advanced strategies for optimizing memory usage in Go programs.
					type Point struct {
    x, y int
}

func main() {
    p := new(Point)
    // Use p...
    p = nil // Explicitly release memory by setting to nil
}
This code snippet allocates memory for a Point struct and later releases it explicitly by setting the pointer to nil.
Advanced Memory Management Techniques
Manual Memory Management
While Go provides automatic memory management through garbage collection, there are scenarios where manual memory management can offer more control and optimization opportunities. We’ll explore advanced techniques for manual memory management in Go, such as using unsafe package and managing memory pools
Memory Fragmentation Analysis
Memory fragmentation can significantly impact the performance of an application by leading to inefficient memory usage. We’ll discuss techniques for analyzing memory fragmentation and strategies for mitigating its effects in Go programs.
					// Using sync.Pool for memory pooling
import (
    "sync"
)

var pool = sync.Pool{
    New: func() interface{} {
        return make([]byte, 1024)
    },
}

func main() {
    data := pool.Get().([]byte)
    defer pool.Put(data)
    // Use data...
}
This code snippet demonstrates the use of sync.Pool for memory pooling, which can reduce the overhead of memory allocation by reusing allocated memory.
Memory Profiling in Concurrent Applications
Concurrent Memory Profiling
Profiling memory usage in concurrent applications introduces additional complexities due to concurrent memory access and synchronization. We’ll discuss techniques for profiling memory usage in concurrent Go programs and handling synchronization overhead.
Channel and Goroutine Profiling
Channels and goroutines are fundamental concurrency primitives in Go, and profiling their memory usage is crucial for optimizing concurrent applications. We’ll explore techniques for profiling memory usage related to channels and goroutines, including identifying blocking points and excessive goroutine creation.
					import (
    "fmt"
    "sync"
)

func main() {
    var wg sync.WaitGroup
    ch := make(chan int)

    wg.Add(1)
    go func() {
        defer wg.Done()
        for i := 0; i < 1000; i++ {
            ch <- i
        }
        close(ch)
    }()

    for num := range ch {
        fmt.Println(num)
    }

    wg.Wait()
}
- This code snippet demonstrates a concurrent program using channels and goroutines.
- Profiling such programs involves analyzing memory usage patterns within goroutines and channel buffers.
Real-time Memory Monitoring and Alerting
Real-time Memory Monitoring
Real-time memory monitoring enables developers to track memory usage dynamically and detect anomalies as they occur. We’ll discuss techniques and tools for implementing real-time memory monitoring in Go applications.
Alerting and Remediation
Implementing alerting mechanisms based on memory usage thresholds helps in proactively addressing memory-related issues. We’ll explore how to set up alerting systems and automated remediation strategies for memory-related issues in Go applications.
					import (
    "fmt"
    "runtime"
    "time"
)

func main() {
    go func() {
        for {
            var mem runtime.MemStats
            runtime.ReadMemStats(&mem)
            if mem.HeapAlloc > 1e9 { // Example threshold: 1GB
                fmt.Println("Heap memory usage exceeds threshold!")
                // Trigger alerting mechanism or take remedial action
            }
            time.Sleep(1 * time.Minute) // Check every minute
        }
    }()
}
This code snippet demonstrates a goroutine for real-time memory monitoring, periodically checking heap memory usage and triggering alerts if it exceeds a predefined threshold.

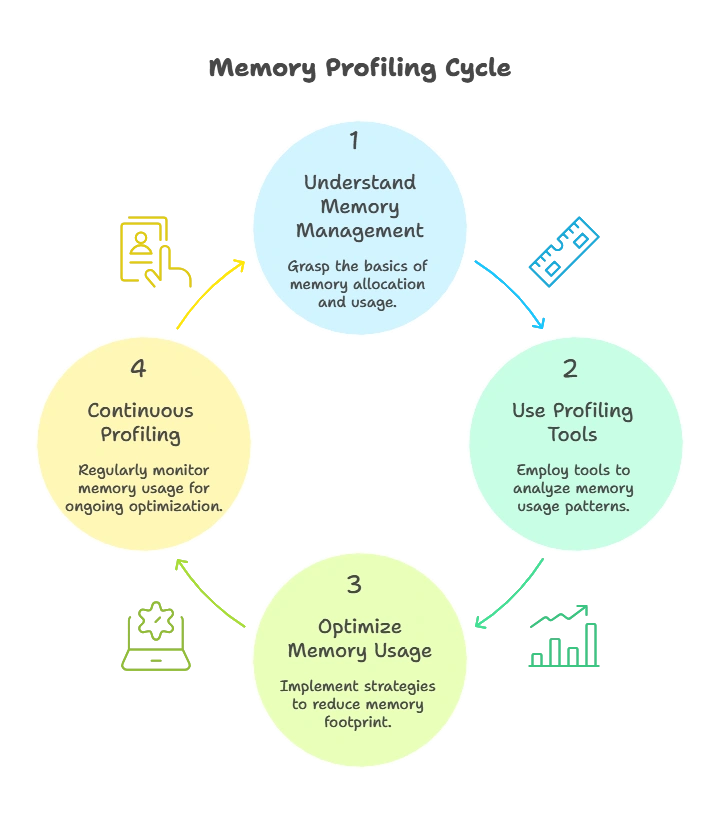
Memory profiling is a powerful tool for identifying and optimizing memory usage in Go programs. By understanding memory management, using profiling tools effectively, and employing optimization strategies, developers can build more efficient and scalable applications. Continuous profiling and optimization are key to maintaining optimal performance in Go applications. Happy coding !❤️
