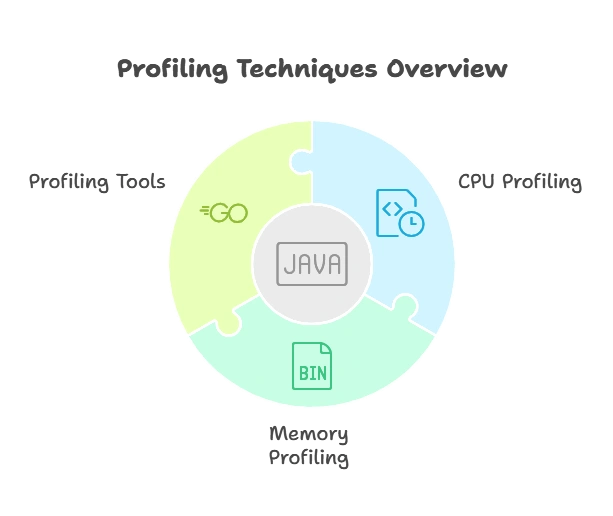
CPU and Memory Profiling
Profiling CPU and memory usage is a critical aspect of optimizing the performance of Go applications. By identifying bottlenecks and memory inefficiencies, developers can improve the overall responsiveness and efficiency of their programs. This chapter explores the fundamentals of CPU and memory profiling in Go, covering basic concepts, practical examples, and advanced techniques to empower developers with the tools needed to analyze and optimize their code effectively.
Understanding Profiling Basics
Basic Concepts
Profiling involves collecting runtime data about a program’s execution to analyze its performance characteristics. CPU profiling focuses on identifying where the program spends its time, while memory profiling aims to uncover memory allocation patterns and potential leaks.
Profiling Techniques
Go provides built-in support for CPU and memory profiling through the pprof package and tools like go tool pprof. These tools allow developers to generate profiling data, visualize it, and analyze performance bottlenecks.

Profiling CPU Usage
CPU Profiling with pprof
CPU profiling in Go is straightforward with the pprof package. By importing "runtime/pprof", developers can start and stop CPU profiling and generate profile reports
					import (
    "os"
    "runtime/pprof"
)

func main() {
    f, _ := os.Create("cpu.prof")
    defer f.Close()
    pprof.StartCPUProfile(f)
    defer pprof.StopCPUProfile()

    // Your application code here
}
This code starts CPU profiling when the program starts and stops it when the program exits, writing the profiling data to a file named “cpu.prof”.
Analyzing CPU Profiles
Once the CPU profiling data is collected, developers can analyze it using the go tool pprof command-line tool or a web-based interface. This allows them to identify hotspots in the code where the program spends the most time.
go tool pprof cpu.prof
This command opens an interactive shell where developers can analyze CPU profiling data and generate reports to identify performance bottlenecks.
Profiling Memory Usage
Memory Profiling with pprof
Memory profiling in Go is also supported by the pprof package. Developers can use it to capture memory allocation data and identify memory-intensive parts of their code.
					import (
    "os"
    "runtime/pprof"
)

func main() {
    f, _ := os.Create("mem.prof")
    defer f.Close()
    pprof.WriteHeapProfile(f)

    // Your application code here
}
This code captures memory allocation data and writes it to a file named “mem.prof” when the program exits.
Analyzing Memory Profiles
Similar to CPU profiling, memory profiling data can be analyzed using the go tool pprof command-line tool or a web-based interface. Developers can visualize memory allocation patterns, identify memory leaks, and optimize memory usage.
go tool pprof mem.prof
This command opens an interactive shell for analyzing memory profiling data, allowing developers to identify memory-consuming parts of their code.
Advanced Profiling Techniques
Goroutine Profiling
Goroutine profiling focuses on analyzing the concurrency behavior of Go programs. Developers can use tools like go tool trace to capture and visualize goroutine execution, helping them understand how goroutines interact and identify potential synchronization issues.
go run -trace trace.out main.go
This command captures a trace of goroutine execution and writes it to a file named “trace.out” for analysis.
Heap Profiling
Heap profiling provides insights into memory allocation patterns and can help identify memory leaks and inefficient memory usage. Developers can use heap profiling tools to generate reports showing memory allocations and deallocations over time.
go test -bench=. -memprofile mem.prof
This command runs benchmarks and captures heap profiling data, allowing developers to analyze memory usage during benchmarking.
Profiling CPU and memory usage in Go is a powerful technique for optimizing the performance and efficiency of applications. By understanding the basics of profiling, utilizing built-in tools like pprof, and exploring advanced techniques such as goroutine and heap profiling, developers can identify bottlenecks, optimize resource usage, and create high-performance Go applications. Happy coding !❤️
