Performance Monitoring and Profiling (New Relic, AppDynamics)
Performance monitoring and profiling are crucial for maintaining the health and responsiveness of Node.js applications, especially as they scale.
Introduction to Performance Monitoring in Node.js
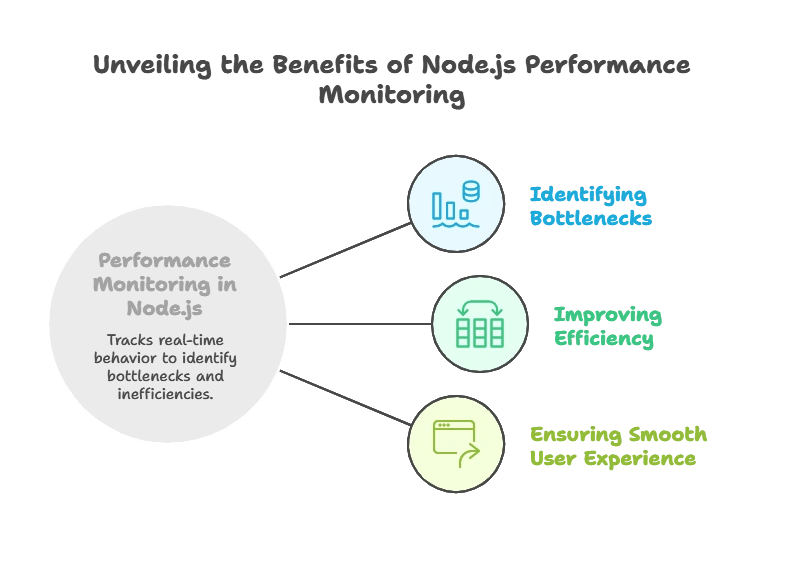
Performance monitoring tracks an application’s real-time behavior, identifying potential bottlenecks and inefficiencies before they impact users. By integrating monitoring tools, you can gain insights into your application’s performance, quickly respond to issues, and ensure a smooth user experience.

Importance of Monitoring and Profiling
Monitoring and profiling provide crucial data, such as memory usage, CPU usage, response times, and error rates. By constantly tracking these metrics, you can:
- Detect and fix performance issues early.
- Understand resource consumption and optimize code.
- Identify memory leaks and slow functions.
- Scale applications effectively as they grow.
Understanding Performance Metrics
To monitor and profile effectively, it’s important to understand key performance metrics:
CPU Usage
The CPU usage of a Node.js application can indicate if there are computational bottlenecks, especially if usage is consistently high.
Memory Usage
Memory leaks are a common problem in Node.js, as they can cause the application to slow down or crash. Monitoring memory usage helps in identifying leaks and understanding how memory is allocated.
Response Time and Throughput
- Response Time: How quickly the application responds to requests.
- Throughput: The number of requests the server can handle per second.
Introduction to New Relic
New Relic is a comprehensive application monitoring tool that offers deep insights into application performance.
Features and Benefits
- Real-time monitoring: Track application behavior in real-time.
- Error tracking: Identify errors and exceptions as they occur.
- Transaction traces: Pinpoint slow database queries and functions.
- Customizable alerts: Receive alerts based on custom performance thresholds.
Setting Up New Relic with Node.js
1. Create a New Relic account and install the New Relic Node.js agent.
2. Install the New Relic package in your application:
npm install newrelic
2. Remove Development Dependencies: Use npm install --production to install only production dependencies, reducing the size of your deployed application.
3. Set Production-Specific Settings: Enable production configurations for performance, such as turning off debug logging and enabling caching.
					require("newrelic"); // should be the first line
const express = require("express");
const app = express();
Key Metrics and Dashboards
Once configured, New Relic provides dashboards displaying:
- Transaction metrics: Shows time spent in different application layers.
- Error analytics: Track, filter, and analyze errors.
- CPU and memory usage: Visualize CPU and memory usage patterns.
- Database performance: Monitor database query performance.
AppDynamics Overview
AppDynamics offers powerful tools for monitoring and optimizing application performance, focusing on business transactions and end-to-end monitoring.
Features and Benefits
- Business transaction monitoring: Provides insights at the transaction level.
- End-to-end visibility: Monitors performance from server to browser.
- Automated alerts: Notifies you of issues based on thresholds.
- Detailed diagnostics: Drill down into individual transactions.
Setting up AppDynamics with Node.js
1. Create an AppDynamics account and access the Controller UI.
2. Install the AppDynamics Node.js agent:
npm install appdynamics
3. Configure AppDynamics:
Create a file named appdynamics-config.js and include the controller details:
					require("appdynamics").profile({
  controllerHostName: "your-controller-host",
  controllerPort: 443,
  controllerSslEnabled: true,
  accountName: "your-account-name",
  accessKey: "your-access-key",
  applicationName: "your-app-name",
  tierName: "your-tier-name",
  nodeName: "your-node-name"
});
4. Start AppDynamics in your app by requiring it in the main file:
					require("./appdynamics-config");
const express = require("express");
const app = express();
Key Metrics and Dashboards
AppDynamics provides several key insights:
- Response time breakdown: Tracks time spent in various layers.
- Error rates and alerts: Shows error rates across transactions.
- Database performance: Identifies slow queries and long response times.
- Hardware metrics: Displays CPU and memory usage data.
Comparing New Relic and AppDynamics
| Feature | New Relic | AppDynamics |
|---|---|---|
| Setup Complexity | Simple and easy to set up | Moderate setup complexity |
| Business Transactions | Limited | Comprehensive |
| Error Tracking | Robust error analytics | Real-time error tracking |
| End-to-End Monitoring | Limited | End-to-end, from server to browser |
| Custom Alerts | Extensive alert configurations | Automated alerts based on trends |
Best Practices for Monitoring and Profiling in Node.js
- Use a combination of tools: Use different tools based on specific needs. For example, use New Relic for general monitoring and AppDynamics for deep transaction analysis.
- Monitor all key metrics: Track CPU, memory, and response times continuously.
- Set up alerting for critical metrics: Customize alerts for important thresholds, such as high response times or error rates.
- Regularly profile the application: Identify bottlenecks and optimize code based on performance insights.
Performance monitoring and profiling are essential components in maintaining a healthy, high-performing Node.js application. New Relic and AppDynamics are powerful tools that provide real-time visibility and actionable insights into application performance. By monitoring CPU, memory, and response times, and by setting up alerts and monitoring business transactions, developers can ensure that their applications meet performance expectations and remain resilient as they scale. Happy Coding!❤️
