Storing and Analyzing Time Series Data in MongoDB
Time series data is a type of data collected at regular intervals over time. Common examples include stock prices, temperature readings, and website traffic. MongoDB is well-suited for managing time series data due to its flexibility, scalability, and ability to handle large datasets. In this chapter, we’ll cover everything from basic time series data concepts to advanced techniques for storing, managing, and analyzing time series data in MongoDB.
Understanding Time Series Data
What is Time Series Data?
Time series data is simply a sequence of data points recorded at successive times, typically with equal time intervals between them. Examples include:
- Temperature readings every hour.
- Stock prices collected every second.
- Sensor data from IoT devices at regular intervals.
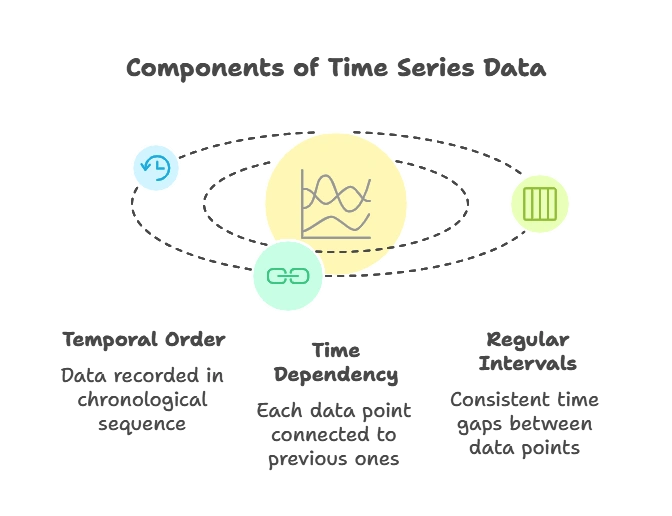
Key Characteristics:
- Temporal Order: Data is recorded in chronological order.
- Time Dependency: Each data point is connected to previous data points.
- Regular Intervals: Most time series data has consistent intervals.

Setting Up MongoDB for Time Series Data
Installing MongoDB
- Download MongoDB from mongodb.com.
- Follow the installation instructions specific to your operating system.
- Launch MongoDB using
mongodand start the MongoDB shell withmongo.
Creating a MongoDB Collection for Time Series
MongoDB provides a specialized schema for time series collections, optimized to handle large volumes of time-stamped data.
					db.createCollection("temperatureReadings", {
   timeseries: {
      timeField: "timestamp",   // Field for the time
      metaField: "location",    // Field for metadata (e.g., location, device ID)
      granularity: "minutes"    // Data collection interval (seconds, minutes, or hours)
   }
});
Explanation:
- timeField: Specifies the field that contains the timestamp.
- metaField: An optional field to store metadata, allowing for grouping.
- granularity: Helps MongoDB optimize storage by defining the frequency of time series data
Storing Time Series Data
Inserting Time Series Data
Once the collection is created, you can insert time series data as regular documents.
Example: Adding temperature readings every hour.
					db.temperatureReadings.insertMany([
   { timestamp: new Date("2024-10-25T08:00:00Z"), location: "New York", temperature: 18.2 },
   { timestamp: new Date("2024-10-25T09:00:00Z"), location: "New York", temperature: 18.5 },
   { timestamp: new Date("2024-10-25T10:00:00Z"), location: "New York", temperature: 19.1 }
]);
Explanation:
Each document contains:
- A timestamp to track the time of data recording.
- location as metadata, allowing easy grouping and filtering.
- temperature to represent the recorded data.
Querying Time Series Data
MongoDB provides several query options to filter and aggregate time series data.
Basic Filtering
Retrieve data based on time ranges:
					db.temperatureReadings.find({
   timestamp: { $gte: new Date("2024-10-25T08:00:00Z"), $lte: new Date("2024-10-25T10:00:00Z") }
});
Explanation:
- $gte and $lte operators filter data within a time range.
Aggregation Queries
MongoDB’s aggregation framework enables you to analyze time series data using various stages such as $match, $group, and $sort.
Example: Average temperature per hour.
					db.temperatureReadings.aggregate([
   {
      $group: {
         _id: { hour: { $hour: "$timestamp" } },
         avgTemperature: { $avg: "$temperature" }
      }
   },
   { $sort: { "_id.hour": 1 } }
]);
Explanation:
- $group groups data by hour and calculates the average temperature.
- $sort sorts the output by hour in ascending order.
Analyzing Time Series Data
MongoDB allows for advanced time series analysis using aggregation pipelines and additional operators.
Trend Analysis
Identify trends over time by calculating the moving average of temperature data.
Example: 3-hour moving average.
					db.temperatureReadings.aggregate([
   { $sort: { timestamp: 1 } },
   {
      $setWindowFields: {
         partitionBy: "$location",
         sortBy: { timestamp: 1 },
         output: {
            movingAvgTemp: { $avg: "$temperature", window: { range: [-3, 0], unit: "hour" } }
         }
      }
   }
]);
Explanation:
- $setWindowFields allows for window-based analysis.
- window specifies a 3-hour rolling window to calculate the moving average.
Seasonal Analysis
In MongoDB, seasonal patterns can be observed by grouping data based on days, months, or years.
Example: Average temperature per month.
					db.temperatureReadings.aggregate([
   {
      $group: {
         _id: { month: { $month: "$timestamp" } },
         avgTemperature: { $avg: "$temperature" }
      }
   },
   { $sort: { "_id.month": 1 } }
]);
Explanation:
- $month extracts the month, enabling seasonal group analysis.
Indexing and Performance Optimization
MongoDB’s indexing options ensure efficient data retrieval for time series collections.
Creating Indexes for Time Series Data
db.temperatureReadings.createIndex({ timestamp: 1, location: 1 });
Explanation:
- An index on timestamp and location helps speed up queries filtering by time range and location.
Storage Optimization
- Use compression and archiving for old data.
- Consider sharding for very large datasets, which distributes data across multiple servers for improved scalability.
Data Visualization Techniques
Visualizing time series data helps identify trends and patterns. MongoDB integrates with visualization tools like MongoDB Charts, Grafana, and Tableau.
MongoDB Charts Example
- Install MongoDB Charts from MongoDB Cloud.
- Import the data and create time series line charts, heatmaps, and bar graphs to visualize patterns like seasonal trends or peaks.
Time series data is invaluable across various fields. MongoDB’s specialized time series collections and powerful aggregation framework make it an ideal database for storing, managing, and analyzing large volumes of time-stamped data. By following best practices for schema design, indexing, and visualization, MongoDB users can gain critical insights from their time series data efficiently and at scale. Happy coding !❤️
