Memory and CPU profiling
In software development, understanding how your program utilizes memory and CPU resources is crucial for optimizing performance and identifying potential bottlenecks. Memory profiling involves analyzing how memory is allocated and deallocated within a program, while CPU profiling focuses on understanding how much CPU time is spent executing different parts of the code. In this chapter, we'll delve into both memory and CPU profiling techniques in the context of C programming.
Memory Profiling
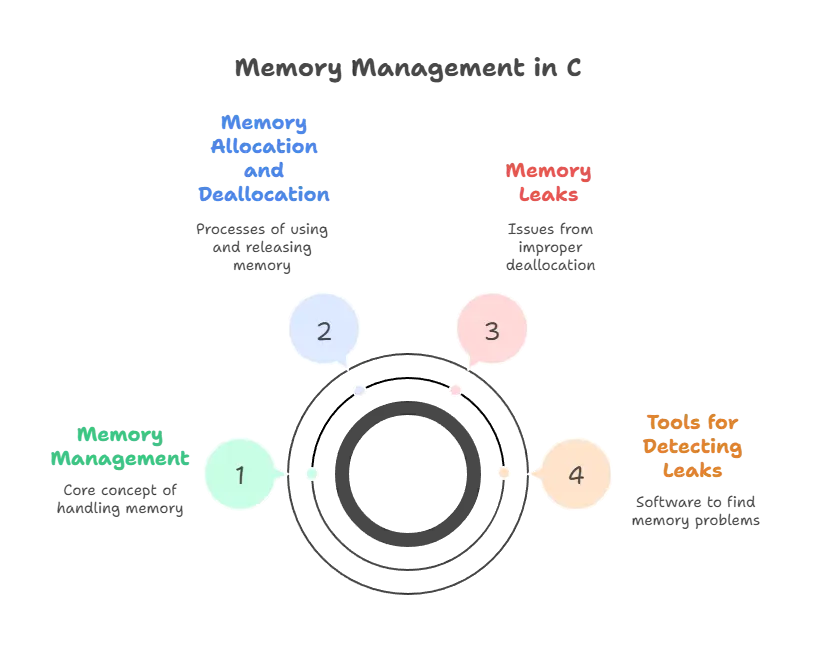
Memory profiling helps us understand how our program manages memory, including allocation, deallocation, and potential memory leaks.
Memory Allocation and Deallocation
In C, memory is typically allocated using functions like malloc() and deallocated using free(). Let’s consider a simple example
					#include <stdlib.h>

int main() {
    int *ptr = (int *)malloc(sizeof(int));
    *ptr = 10;
    free(ptr);
    return 0;
}
Explanation:
- We allocate memory for an integer using
malloc(). - We assign a value to the allocated memory.
- Finally, we free the allocated memory using
free().
Detecting Memory Leaks
Memory leaks occur when allocated memory is not properly deallocated, leading to a waste of memory resources. Tools like Valgrind can be used to detect memory leaks. For example:
$ valgrind ./my_program
Valgrind will provide detailed information about memory leaks, if any, in your program.

Memory Profiling
CPU profiling is a critical aspect of performance optimization in software development. It involves analyzing how much CPU time is consumed by various parts of a program’s execution. Understanding CPU profiling allows developers to identify hotspots in their code where significant computational resources are being expended, enabling them to optimize those areas for better performance.
Profiling with Time Command
The time command is a simple yet effective tool for measuring the execution time of a program. When a program is executed with time, it provides information about the real, user, and system time taken by the program to complete its execution.
- Real Time: The actual elapsed time from start to finish of the program’s execution.
- User Time: The amount of CPU time spent executing the program’s code in user space (i.e., executing the program’s instructions).
- System Time: The amount of CPU time spent executing system calls on behalf of the program (e.g., I/O operations).
By analyzing these time metrics, developers can gain insights into how efficiently their program utilizes CPU resources and identify potential areas for optimization.
Suppose we have a C program named my_program that performs some computational tasks. We can measure its execution time using the time command:
$ time ./my_program
The output will provide information about the real, user, and system time taken by my_program to execute.
Profiling with GProf
GProf is a profiling tool that helps developers analyze the execution flow of a program and identify functions that consume the most CPU time. It generates a detailed report containing information about the number of times each function is called, the percentage of total execution time spent in each function, and the call graph illustrating function dependencies.
To use GProf:
- Compile the program with the
-pgflag to include profiling instrumentation
$ gcc -pg my_program.c -o my_program
Run the program to generate profiling data
$ ./my_program
Analyze the profiling data using GProf
$ gprof ./my_program
GProf’s output helps developers identify performance bottlenecks in their code and prioritize optimization efforts accordingly.
Example:
Consider a scenario where we have a C program consisting of multiple functions, and we want to identify which functions consume the most CPU time. We can use GProf to generate a profiling report:
$ gprof ./my_program
The generated report provides detailed information about function execution times and call graphs, enabling us to pinpoint areas for optimization.
Memory and CPU profiling are essential techniques for optimizing the performance of C programs. By understanding how memory is managed and where CPU time is spent, developers can identify areas for improvement and enhance overall program efficiency. Utilizing tools like Valgrind and GProf can greatly assist in this process, providing insights into memory usage and CPU performance. By incorporating memory and CPU profiling into the development workflow, programmers can create faster, more efficient C programs.Happy coding!❤️
