Profiling tools and techniques
Profiling is a crucial aspect of software development, especially when it comes to optimizing performance and identifying bottlenecks in your code. In this section, we'll delve into what profiling is and why it's essential for C programmers.
What is Profiling?
Profiling is the process of analyzing a program’s performance characteristics to identify areas for improvement. It involves measuring various metrics such as execution time, memory usage, and CPU utilization.
Why is Profiling Important?
Profiling helps developers understand how their code performs in real-world scenarios. By identifying performance bottlenecks, developers can optimize their code to improve efficiency and responsiveness.
Types of Profiling
Profiling can be categorized into several types, each focusing on different aspects of performance analysis. Let’s explore these types in detail.
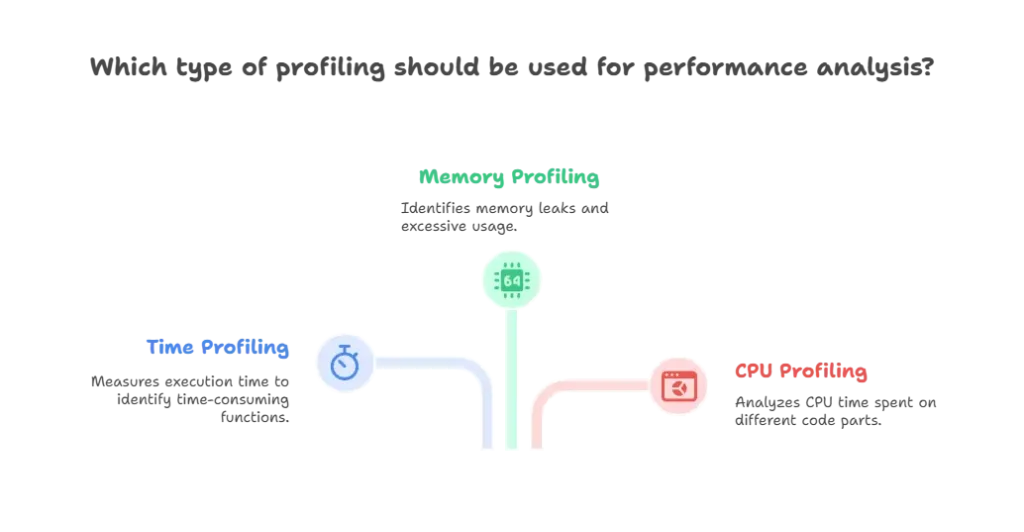
Time Profiling
Time profiling involves measuring the execution time of different parts of your program. It helps identify which functions or sections of code are consuming the most time.
					#include <stdio.h>
#include <time.h>

void time_consuming_function() {
    for (int i = 0; i < 1000000; ++i) {
        // Simulating a time-consuming operation
    }
}

int main() {
    clock_t start = clock();
    time_consuming_function();
    clock_t end = clock();

    double time_taken = ((double)(end - start)) / CLOCKS_PER_SEC;
    printf("Time taken: %f seconds\n", time_taken);
    return 0;
}
					// output //
Time taken: 0.019246 seconds
Memory Profiling
Memory profiling helps identify memory leaks, excessive memory usage, and fragmentation issues in your program.
					#include <stdio.h>
#include <stdlib.h>

int main() {
    int *ptr = (int *)malloc(100 * sizeof(int));
    // Perform operations using ptr
    free(ptr); // Freeing memory
    return 0;
}
CPU Profiling
CPU profiling analyzes how much CPU time is spent executing different parts of your code. It helps identify CPU-bound tasks and potential optimizations.
Example: (CPU profiling often requires specialized tools and libraries.)

Profiling Tools
Numerous tools are available for profiling C programs, each offering unique features and capabilities. Let’s explore some popular profiling tools and how to use them.
GProf
GProf is a profiling tool available on Unix-like systems, including Linux. It provides statistical profiling information, including the number of calls to each function and the time spent in each function.
Example: (Instructions on how to compile and run a program with GProf, along with interpreting its output.)
Valgrind
Valgrind is a powerful tool for memory profiling and debugging. It detects memory leaks, invalid memory access, and other memory-related errors.
Example: (Instructions on how to use Valgrind to analyze a C program for memory issues.)
Perf
Perf is a performance analysis tool available on Linux systems. It provides insights into CPU usage, cache misses, and other performance-related metrics.
Example: (Demonstration of using Perf to analyze the performance of a C program.)
Profiling Techniques
In addition to using profiling tools, developers can employ various techniques to optimize their code further. Let’s explore some common profiling techniques.
Code Instrumentation
Code instrumentation involves adding additional code to your program to collect profiling data dynamically. This data can include function execution times, memory allocations, and more.
Example: (Demonstration of adding instrumentation code to a C program to collect performance data.)
Sampling Profiling
Sampling profiling involves periodically sampling the program’s state to collect performance data. It provides a non-intrusive way to analyze code performance.
Example: (Explanation of how sampling profiling works and how to implement it in a C program.)
Profiling is a vital tool for C programmers to optimize their code and improve performance. By using profiling tools and techniques, developers can identify bottlenecks, memory leaks, and CPU-intensive tasks, leading to more efficient and responsive software.Remember, profiling is an iterative process, and continuous optimization is key to developing high-performance C programs. So, make sure to profile your code regularly and apply optimizations as needed. Happy coding!❤️
